Capital Desk · 9 October 2026
Rising prices are not rising wealth: where large capital sits, and what owners actually keep
Subtitle: Wealth is concentrated and property prices have risen. Neither fact tells an owner what an asset will pay.
In short. Headline figures about large capital measure different things — stocks at a date, flows over a period, survey answers, deal volumes and price indices. They cannot be added up. For an owner the question is simpler and harder: how much cash comes back, and when, after costs, tax, risk and exit.
Who this is for: families and principals weighing a deposit, securities, a fund or a building — and the lawyers, family-office CFOs and private bankers who advise them.
Big numbers answer different questions
Capgemini estimates $98.3 trillion of financial wealth among 25.3 million high net worth individuals at the end of 2025 (World Wealth Report 2026, 4 June 2026). UBS estimates 57.5 million US dollar millionaires in its sample of 56 markets; those above the $1 million net worth threshold held 48.4% of wealth in that sample (Global Wealth Report 2026, 30 June 2026). The figures are arresting. They are also answers to different questions.
Capgemini excludes a primary residence; UBS includes nonfinancial assets less debt. The populations overlap, so their people, assets and percentages cannot be added.
Russia offers a sharper illustration. 0.2% of depositors held 30.2% of insured individual deposits in the over RUB 10 million group at the start of 2026 (Deposit Insurance Agency, 18 February 2026). On 1 July 2026, that group held 30.3% (Deposit Insurance Agency, H1 2026 monitoring). At brokers, 14,800 individuals with portfolios from RUB 100 million held RUB 6.1 trillion, about 45% of RUB 13.6 trillion of individual assets at the end of June (Bank of Russia, 25 August 2026; share: 6.1/13.6). These are concentrations inside account systems.
Reading the data. The Russian deposit agency counts a depositor separately at each bank. A person with accounts at several banks can appear several times. Brokerage, bank and private banking populations overlap as well.
A map of capital, not a pile of money
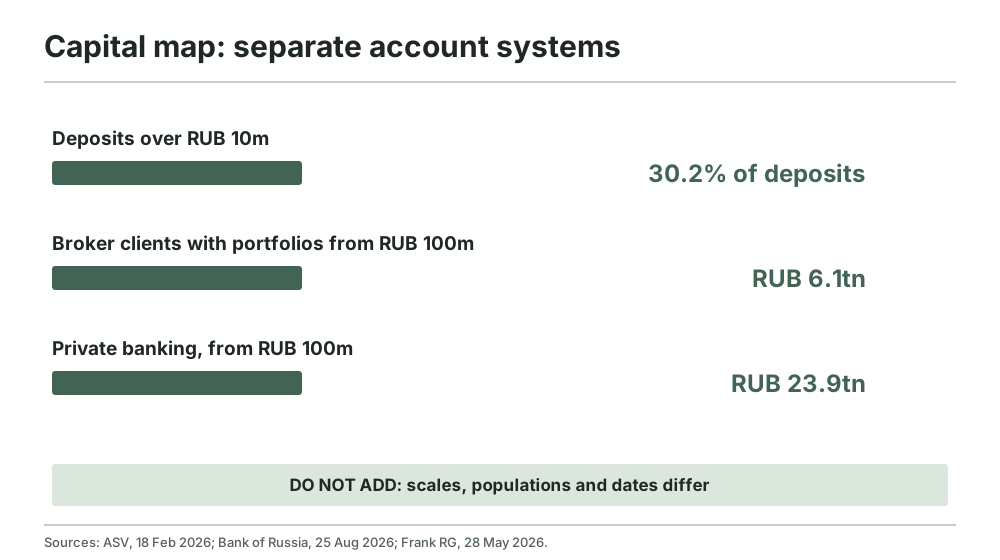
Frank RG estimates RUB 23.9 trillion of financial capital among Russian private banking clients in the RUB 100 million and above segment at the end of 2025. Its annual growth slowed from 40% in 2024 to 12% in 2025; new money contributed only 2% of growth, down from 25% a year earlier (Frank RG, 28 May 2026). A growing stock of assets need not mean a similarly large cash inflow.
The Bank of Russia reports RUB 13.3 trillion of individual brokerage assets at the end of the first quarter of 2026 and RUB 13.6 trillion at the end of the second (broker review, 25 August 2026). The two numbers are successive observations of the same series. The balance includes securities, cash and net claims, including individual investment accounts. It is not an extra pot to add to the private banking estimate: the same owner can feature in both.
Moving money is not the same as stated intent

Russian individuals made RUB 1.1 trillion of net contributions to brokerage accounts in the second quarter of 2026, the highest quarterly figure since 2021. Qualified investors provided 63% of that net flow (Bank of Russia, 25 August 2026). "Net" means transfers in minus transfers out of cash, securities and other client-directed assets; coupons and dividends credited directly to the account are excluded. It does not identify the securities bought, or prove a shift out of real estate.
Among private banking clients surveyed, 54% would consider government bonds instead of a deposit, 45% money market funds and 18% closed-end property funds. Multiple answers were allowed (Frank RG, 28 May 2026). These are intentions, not orders or ruble inflows.
Russian property investment transactions totalled a final RUB 973 billion in 2025 (IBC Real Estate, 29 January 2026) and a preliminary RUB 373 billion in the first half of 2026, 12% lower year on year (IBC Real Estate, July 2026). The figures include commercial property, housing and development sites, and buyers beyond individuals.
Reading the data. A stock is a value at a date; a flow is movement during a period. A survey records answers. A transaction-volume estimate covers deals in its defined market. The distinctions determine what each number can support.
"It will double" — first ask: over how long?
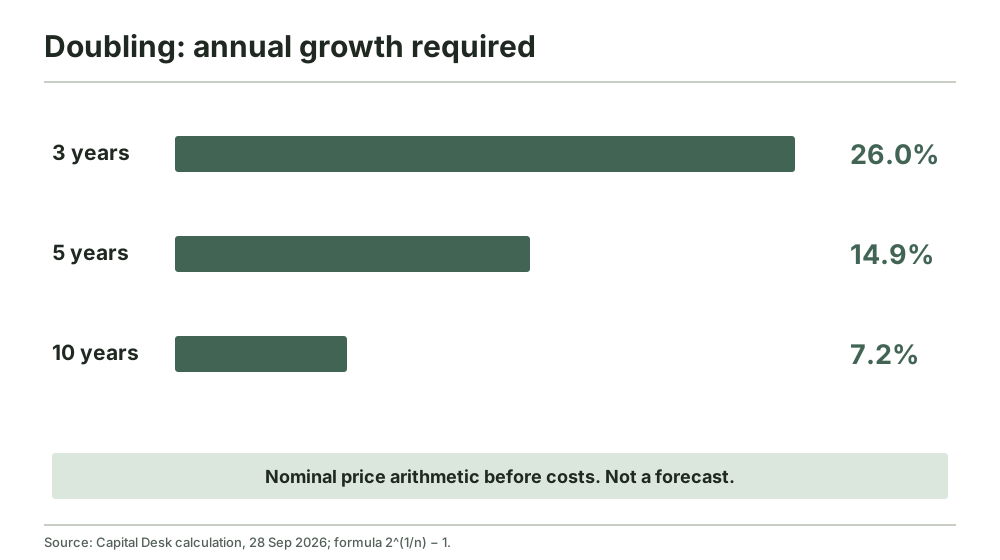
A price doubles with annual compound growth of 26.0% over three years, 14.9% over five, or 7.2% over ten (Capital Desk calculation, 28 September 2026: 2^(1/n) − 1). This nominal arithmetic ignores costs, vacancy, tax and selling friction.
Russia's new-build price index rose about 10.1% nominally (recalculated series; first published as 10.2%) between December 2024 and December 2025. Dividing its 1.1012 price factor by the 1.0559 consumer-price factor (5.59% per Bank of Russia/RIA; Rosstat page not re-read) gives 4.3% real growth for the year (DOM.RF transaction index and Rosstat consumer inflation, calculation as of 28 September 2026; primary DOM.RF page could not be re-read). Neither index is the realised return from buying, holding and selling one apartment.
The mix of location, size and class can move an index. The owner still pays to finish and carry the apartment and may sell at a discount. A return memo needs those costs and an executable exit.
From presentation yield to owner cash

Consider a fictional building advertised with RUB 12 million of annual gross rent. Subtract RUB 1.2 million for vacancy, RUB 1.6 million for running costs, RUB 1.2 million for a capital expenditure reserve and RUB 1 million for assumed taxes and fees. The illustrative cash available before sale is RUB 7 million (synthetic Capital Desk example, 28 September 2026). Those inputs describe no market asset. They show the questions an owner has to resolve.
Replace assumptions with leases, receipts, a rent roll, maintenance records and a tax calculation. Add legal, fit-out and repair costs at entry; selling costs and debt repayment at exit. Gross rent divided by an asking price skips these steps.
An export of commercial offers may show a modelled net operating income and a seller's asking price. Their ratio is a model capitalisation rate at asking prices. It is not a capitalisation rate demonstrated by closed transactions. If a future buyer demands a higher rate for the same income, the exit price falls. Higher vacancy or capital spending can reduce cash before the planned exit even arrives.
Stress weaker rent and a slower, cheaper sale at the same time. Show how each changes the owner's money and dates.
A property fund is an asset plus a rulebook
Closed-end property funds spread exposure across buildings, but add fees, debt, valuation and distribution rules. Net asset value is not automatically an executable exit price.
Parus estimated RUB 1.04 trillion of net asset value for market property funds at the end of June 2026 (Parus, July 2026). VIM Sberezheniya estimated RUB 1.01 trillion for a differently defined fund universe in the first half of the year (VIM research reported by RBC Investments, 7 July 2026). Averaging them would conceal the difference in coverage. VIM also estimated RUB 87.8 billion of net inflows into property funds during January–August 2026 (reported by RBC Investments, 11 September 2026). Inflows are money entering funds, not investor profit or distributions.
Compare underlying properties, tenants, borrowing, fees, paid distributions and a realistic secondary-sale price. Two property funds can have very different cash paths.
Moscow and St Petersburg: a checking order, not a ranking
An internal screen of commercial offers in Moscow and St Petersburg filtered stale quotes, duplicate addresses, very small space and extreme modelled rates before comparing offers within the same use. Its output is a set of due-diligence questions, not a ranking of investments. Prices are asking prices and rental income is modelled. Executed leases, title, building condition and actual expenses decide whether a candidate survives.
The residential screen joined WATCH scenarios to priced offers. A gap below a model valuation identified what to inspect, not a promised resale gain. Rent estimates did not pass the internal quality gate and did not drive the rank (D3 public summary, 28 September 2026).
The public summary withholds numeric aggregates pending reuse rights. No address or client project is disclosed. The screen runs on Sdelio data — Sdelio is my own product.
What to check: five rules for the owner
First, write a cash calendar. Set aside liabilities and reserves before locking up capital.
Second, compare on one basis: date, currency, horizon and after-cost cash.
Third, demand a cash bridge: vacancy, costs, repairs, tax, debt and distributions.
Fourth, name the evidence: observed flows, completed sales, intentions or forecasts.
Fifth, set a revision trigger: the document, price or delay that reverses the decision.
The conclusion fails if…
…signed leases and paid invoices give a materially different cash flow; a real buyer cannot be found near the modelled exit value; or the owner's liabilities require liquidity earlier than expected. The property decision then needs to be recalculated, not defended by repeating the original yield.
It changes if DOM.RF revises its index, IBC revises deal volumes or fund distributions differ. The doubling formula remains; the scenario must be recalculated.
Checked 9 October 2026; next review on release of the Bank of Russia Q3 broker review. The numbered source list gives report dates and links.
Alexander Krasikov, Capital Desk — krasikov.net/en/
This is analysis, not individual investment advice, an offer or a formal valuation. Scenarios are not guarantees. Capital Desk is paid for by the client; any deal commission via Sdelio is disclosed in writing before the deal. Sdelio is my own product. I never ask you to transfer money and never collect documents via messengers.
Method note
Global USD figures are taken from Capgemini and UBS with their own definitions and are never added. Russian ruble figures are presented as a case study; no exchange-rate conversion is used. The full Frank RG report is paid, so its official release supports the cited results. VIM fund figures are available through RBC Investments' summaries. The 5.59% Rosstat CPI is per Bank of Russia/RIA; the Rosstat page was not re-read. The property cash bridge is fictional, and the Moscow and St Petersburg screen is described only at the level cleared in the D3 public summary.
Sources
Dossier checked: 9 October 2026.
- АСВ. «Мониторинг застрахованных вкладов за 2025 год», 18.02.2026, с. 3–4: структура вкладов на 01.01.2026, группа свыше 10 млн ₽. PDF. Для доли на 01.07.2026: мониторинг за I полугодие 2026.
- Банк России. «Обзор ключевых показателей брокеров за II квартал 2026 года», 25.08.2026, с. 3–6, включая сноску 8 о нетто-взносах. PDF; сообщение. Доля 6,1 / 13,6 ≈ 45% рассчитана редакцией.
- Frank RG. «Доверие становится главным фактором на рынке Private banking», 28.05.2026. Финансовый капитал сегмента от 100 млн ₽, динамика и анкета клиентов private banking. Официальный пресс-релиз. Полный отчёт платный и не использовался.
- IBC Real Estate. «2025 Q4. Инвестиции в недвижимость», 29.01.2026: итоговый объём 973 млрд ₽. PDF.
- IBC Real Estate. «2026 Q2. Инвестиции в недвижимость», июль 2026: предварительный объём 373 млрд ₽ за I полугодие, −12% год к году. PDF.
- ДОМ.РФ. Индекс цен новостроек по фактическим сделкам ДДУ, текущий ряд, доступ 28.09.2026. Декабрь 2025 к декабрю 2024: около +10,1% номинально (пересчитанный ряд; первоначально опубликовано 10,2%); в расчёте используется 10,12%. Индекс пересчитывается по регистрации сделок. Первичная страница при повторной проверке не прочитана.
- Росстат. ИПЦ за 2025 год +5,59% декабрь к декабрю; по Банку России/РИА; сообщение РИА Новости от 16.01.2026. Страница Росстата повторно не прочитана. Реальный рост рассчитан редакцией как 1,1012 / 1,0559 − 1 ≈ 4,3%.
- Parus. «Рынок ЗПИФ недвижимости: итоги 1 пол. 2026 года и тренды», июль 2026: СЧА рыночных фондов 1,04 трлн ₽. Материал управляющей компании.
- «ВИМ Сбережения» через «РБК Инвестиции». Оценка СЧА ЗПИФ на I полугодие, 07.07.2026; оценка чистого притока за январь–август, 11.09.2026. Полные отчёты ВИМ не опубликованы; периметр отличается от Parus.
- Capgemini. World Wealth Report 2026, 04.06.2026, с. 9–13, 52: $98.3T финансового капитала и 25.3M HNWI на конец 2025 года. PDF.
- UBS. Global Wealth Report 2026, 30.06.2026, с. 20, 22: 57.5M долларовых миллионеров; 48.4% богатства выборки у группы свыше $1M. Пресс-релиз UBS; доступная копия полного PDF. Числа извлечены из копии полного отчёта, а не из пресс-релиза.
- Capital Desk. Расчёты и вымышленный денежный мост, 28.09.2026: удвоение 2^(1/n) − 1; 6,1 / 13,6; реальный рост 1,1012 / 1,0559 − 1. Данные расчётов: doubling-math.csv, owner-cash-bridge.csv, nominal-real-growth.csv.
- D3. Публичное резюме среза Москвы и Петербурга, 28.09.2026. Численные агрегаты экспорта удержаны до подтверждения прав на повторное использование.